Lesson 25 – Modulation 2#
Learning Outcomes#
Analyze AM modulators in the frequency domain for both sinusoidal and non-sinusoidal inputs
Understand and determine the bandwidth of an AM signal
Understand block diagram Frequency Domain Multiplexing (FDM) systems
Analyze FDM systems in the frequency domain
Modulation 2#
AM with More Than One Frequency#
Although it is instructive to consider how to use a single frequency as a message signal, it is not very practical. In fact, most systems want to send information containing a bandwidth of frequencies. Any communications system, for example, wants to ensure it can at least use data in the audible range (20 Hz – 22kHz) as its message signal. Everything up to this point still applies to a message signal with more than one frequency. For example, consider the following modulation system:

Where vm(t) is now:
In this case, determining the time domain representation of the output signal (vAM) is overly complicated. Even using the distributive law to write the equation of the output signal is overly tedious. However, it is perfectly feasible to draw this signal in the time domain, if we recall that each frequency in the message signal, we will produce two frequencies in the output signal – one at each frequency added to the carrier frequency, and one at each frequency subtracted from the carrier frequency. The amplitude of each frequency will be half of the product of that frequency’s amplitude (in the message signal) and the amplitude of the carrier frequency. So, the example above produces six frequencies in the output:

First, take notice how the spectrum is symmetric around the carrier frequency, fc. The frequencies to the right of the carrier frequency are simply the frequencies from the message signal added to the carrier frequency:
590kHz + 1 kHz = 591 kHz
590 kHz + 3 kHz = 593 kHz
590 kHz + 5 kHz = 595 kHz
The amplitudes of those frequencies are calculated by \(\frac{A_{m}*A_{c}}{2}\):
Finally, observe how the frequencies to the left of the carrier frequency are the higher frequencies reflected (as a mirror image) around the carrier frequency. This represents the difference of the message and carrier frequencies. The amplitudes are also the same as those on the right of the carrier frequency. With this in mind, it does not matter how many frequencies are contained in a signal, we can find the amplitude spectrum by:
Adding the carrier frequency to each message frequency
Calculating the amplitude by \(\frac{A_{m}*A_{c}}{2}\) for each message frequency
Reflecting the results around the carrier frequency on the graph.
Another concept that is useful to understand is the idea of bandwidth. Bandwidth, when taken in context with modulation, is the range of frequencies in a given band, particularly those used for transmitting a signal. When modulating a signal, the transmitter is limited to a certain bandwidth they are allowed to transmit over. To find the bandwidth of a signal, the highest frequency is subtracted from the lowest frequency.
BW = fhigh – flow
Examining our modulated signal, we can determine the bandwidth to be:
BW = fhigh – flow = 595kHz – 585kHz = 10kHz
The bandwidth of a modulated signal is ALWAYS equal to twice the highest frequency of the message signal.
Digital Modulation#
One of the key principles of modulation is that the carrier must be a sinusoidal signal, but the message data can be anything – analog or digital. So far, we have discussed the modulation of analog signals (sinusoids), but it is just as easy to use a digital signal as a message signal. In the case of amplitude modulation, we choose one amplitude as a binary zero (usually 0V) and another as a binary one (5V, for example). When the message signal is a binary zero, the output signal is zero. When the message signal is a one, the output signal’s amplitude is 5V. We call this Amplitude Shift Keying (ASK). We can do the same thing with frequency – one frequency represents a binary zero, while another represents a binary one. This is called Frequency Shift Keying (FSK). The two methods are shown in Figure 1. Many modern systems make use of both methods to transmit information.
Figure 1: Amplitude Shift Keying and Frequency Shift Keying.
Frequency Division Multiplexing (FDM) System#
In order to send two or more signals through the same channel, we consider two options. First, a signal can be sent at any frequency, but only during specified time intervals. This is called Time Division Multiplexing (TDM). Second, a signal can be sent at any time, but only in a specified frequency range. This is Frequency Division Multiplexing (FDM).
FDM is a multiplexing technique used in analog telephone communications, FM stereo, space vehicle telemetry, and many other applications. In FDM, several independent signals are simultaneously transmitted through one channel by allocating each signal a unique band of the available frequency spectrum. Many times the signal will need to be filtered to restrict its bandwidth over the frequency spectrum to prevent interference with other signals. The signals shown in the frequency domain below are from three local Colorado Springs FM radio stations. Notice each signal has its own unique center frequency, but the frequency content is the same for all three stations (in the audible range). This is an example of FDM.
Breaking this process down, FDM involves band-limiting the input signals, moving their spectra through modulation, and combining these into one composite signal. In general, an FDM signal is generated from any number of input signals (i.e., two or more) by translating each one to a unique frequency band. The translated signals are then added together creating the composite FDM signal whose amplitude spectrum consists of the non-overlapping, frequency translated spectrum of all the signals. Your basic FDM system is shown below.
To guarantee no overlap of spectra at the output of the adder, the input signals to the multipliers must not contain frequencies that would overlap with any of the other channels. Low pass filters serve this purpose, with cutoff frequencies set to the highest desired frequency of the input signal.
Example Problem 1#
Two music signals are multiplexed according to the system below. Graph the output signal in the frequency domain.
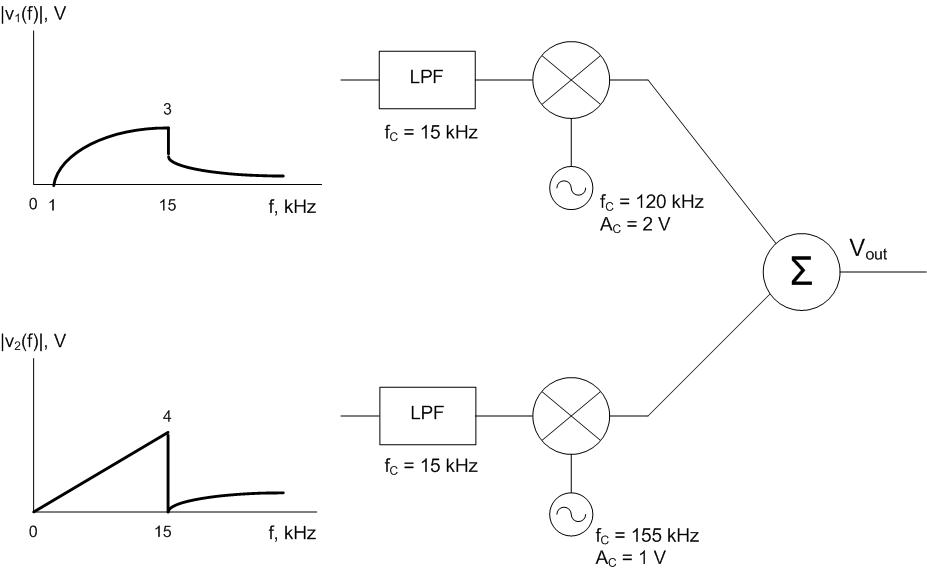
Understand: We are multiplexing signals in the frequency domain (two signals on the same graph). This block diagram may be confusing, but please realize it is using fC to mean two different things in this system. For the filters, fC means the cutoff frequency. For the signals coming into the function multipliers, fC means carrier frequency.
Identify Key Information:
Knowns: We know the frequency content of each input signal, the cutoff frequencies of the band-limiting LPFs, and the amplitude and frequency of each function multiplier.
Unknowns: We want to graph the output spectrum.
Assumptions: The transmission system can support the entire bandwidth.
Plan: We will follow each signal through its own modulation path, taking into account frequencies cut off by the LPFs, and determining the final modulated signal. Since the signals are then added together, they can be plotted on the same axis.
Solve: Consider the first signal and what happens when it passes through the filter. Since fC =15 kHz, every frequency above 15 kHz will be cut off. Therefore, the signal coming out of the filter will be:
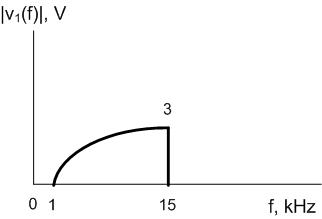
For the second signal, the filter will also kill all frequencies greater than 15 kHz:

Everything else we do is the same (mathematically) as previous problems. We shift the first signal by the carrier frequency, 120 kHz (since this represents the sum of the frequencies), then draw its mirror image (since this represents the difference of the frequencies). Next, we shift the second signal by 155 kHz and draw its mirror image. If the LPFs were not in the signal chain, the output signals would interfere with each other, however, because the filters enforce a channel bandwidth of 30 kHz, though, the resulting signals no longer interfere with each other.
Answer: The output signal for the multiplexing system is shown in the following graph:

